Dispute Performance Analysis
The dashboard helps to track the following.
-
Value and volume of disputes closed in a given time frame
-
Average days to resolve a dispute
-
Top 25 Customers with open disputes
-
Breakup of disputes as per reason code and processor
-
Breakup of disputes closed on a daily basis
By using the combination of above insights, Collections Manager can view the trend of disputes performance and average days to resolve a dispute. This enables them to take decisions, find bottlenecks and improve the dispute resolution process.
|
|
Note This dashboard uses local currency. |
For more details, refer to Viewing Dashboards.
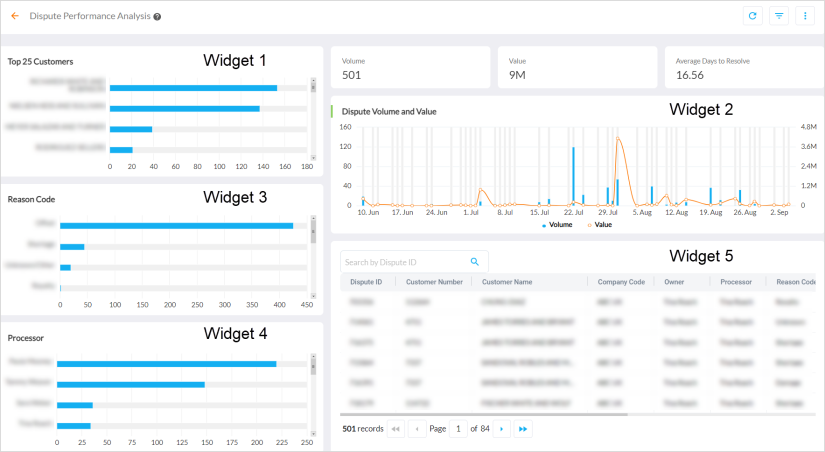
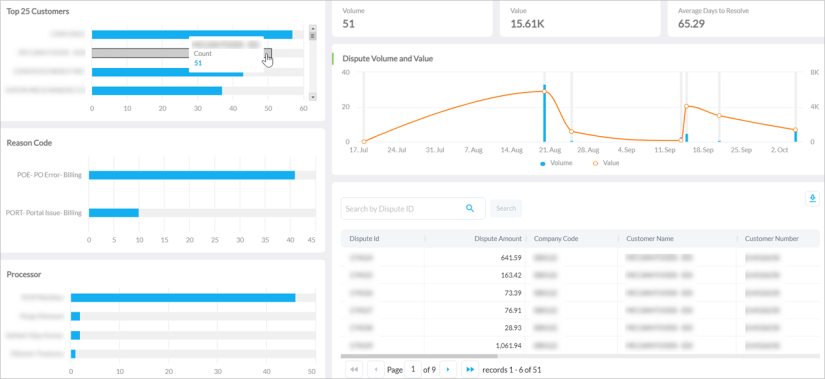
The tiles on dashboard display the following aggregate data:
-
Volume - Count of closed disputes in the selected time frame
-
Value - Disputed Amount of all these closed disputes in the selected time frame
-
Average Days to Resolve - Average number of days taken to resolve, calculated as follows:
(Sum of days to resolve for closed disputes)/(Total number of closed disputes)

Note
The calculation constraints in the dashboard are as follows:
-
Days to resolve = Dispute create date - close date (excluding weekends).
-
Only pre-deduction and pre-credit are considered for the widget.
-
The disputes must be closed and it must be Collection - Disputes.
-
Period selector functionality can be used to view the dashboard data from a specific period.
-
Historical dashboard data for a minimum of one day and a maximum of 90 days can be viewed by using the period selector.
-
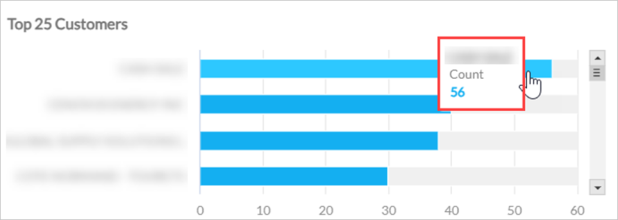
Widget 1 - Top 25 Customers
The widget displays the top 25 customers based on closed disputes. It also provides a suggestion of the list of customers that the Processors must prioritize.
Tooltip - Hovering over a series displays a tooltip of Customer name and the closed disputes count in that particular time period.
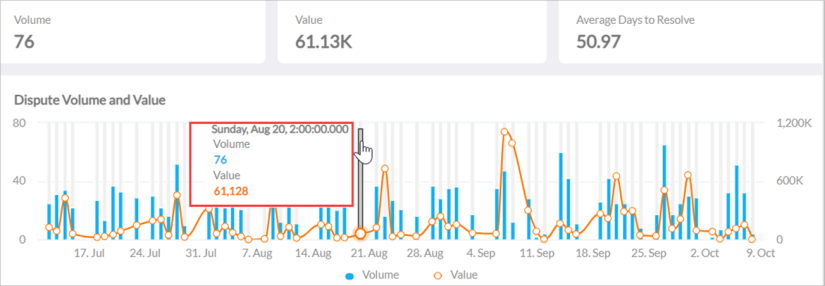
Widget 2 - Dispute Volume and Value
The widget displays the volume and value of closed disputes in the selected time period. The description of axes and series in the widget are as follows:
-
X-axis - Dispute closed date
-
Left Y-axis - Count of disputes closed
-
Right Y-axis - Disputed amount
-
Blue series - Volume or number of disputes closed in a given period of time
-
Orange series - Amount or value of disputes closed in a given period of time
Clicking on either of the series at any point, filters the data in Widget 1 (Volume and Value).
Widget 3 - Reason Code
This widget displays various reason codes assigned to disputes and the number of disputes closed against each reason code.
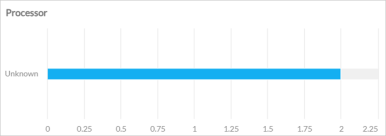
Widget 4 - Processor
This widget displays the names of the processors and the number of disputes that are closed against them. The description of axes and series in the widget are as follows:
- X-axis - Dispute closed count
-
Y-axis - List of Processors
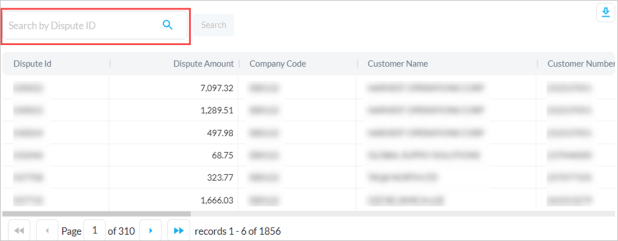
Widget 5 - Grid
The widget provides the following details:
-
Drill-down of disputes closed in the selected time frame.
-
Dispute ID, Customer Number, Disputed Amount, Resolve Amount, Dispute Status, and Days to resolve.
|
|
Note The field Days To Resolve displays the difference between closed date and created date of the dispute excluding weekends. |
The details of a particular dispute can be searched by entering the Dispute ID in the search bar above the grid header. Click the Download icon to export the data of the widget as a CSV file.
Out-of-the-Box Features
The Out-of-the-Box features and functionalities of the dashboard are as follows:
-
Cross Filtering - Slices and dices between multiple dimensions. For example, clicking on a particular point on bar graph will filter the entire data of dashboard for the selected bar or point.
-
Standard Out-of-the-Box Filters - Filters the entire dashboard on the basis of Company Code, Owner, Customer Segment, Dispute Status and Collector.
-
Date Range - Filters the data displayed in the report as per the required date range. The maximum time period selection is three months.
-
Kebab Menu - Click this icon to access options such as download, schedule, and mark the dashboard as favorite. For more details, refer to Using Kebab Menu Options.