Days Sales Outstanding based on Annual Sales
The Days Sales Outstanding based on Annual Sales report utilizes a spline chart to display the Days Sales Outstanding (DSO) and Best Possible DSO (BPDSO) calculated using the following formulas.
-
DSO = ((Total AR at the end of the month )/(Credit sales in preceding 12 months)*365)
-
BPDSO = ((Total Current AR at the end of the month)/(Credit sales in preceding 12 months)*365)
The following are the features and uses of DSO.
-
Measures the average days required for a sale to convert into cash.
-
Represents the time taken by customers to pay cash.
-
DSO not only measures the time in which the AR will be paid off, but also measures the liquidity on hand.
-
Helps in understanding the financial health.
|
|
Note The calculation constraints in the report are as follows:
|

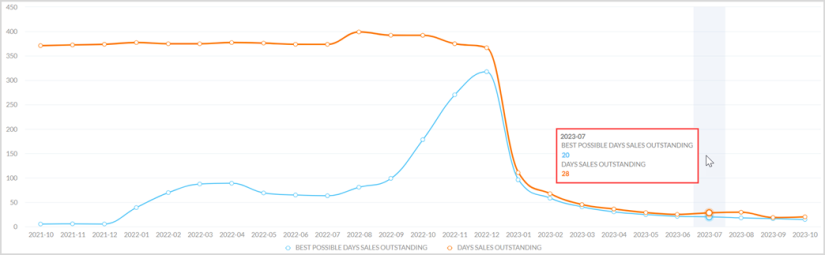
The description of axes and series in the report are as follows:
- X-axis - Month and Year
-
Y-axis - DSO values
-
Blue series - BPDSO
-
Orange series - DSO
|
|
Note By default, both series are displayed. Clicking a legend at bottom of the graph enables or disables that series. |
Tooltip - Hovering over a point in the series displays a tooltip of the date and the respective BPDSO and DSO values based on the selected filters.
Out-of-the-Box Features
The Out-of-the-Box features and functionalities of the report are as follows:
-
Standard Out-of-the-Box Filters - Filters the entire report on the basis of Collector, Company Code, Customer Segment, and Owner.
-
Date Range - Filters the data displayed in the report as per the required date range. The maximum time period selection is 24 months and the minimum is one month.
-
Kebab Menu - Click this icon to access options such as download, schedule, and mark the report as favorite. For more details, refer to Using Kebab Menu Options.